Supervised vs Unsupervised (Classification)
2. Classification Model:
Trained on the training dataset and based on that training, it categorizes the data into different classes.
Example: The best example to understand the Classification problem is Email Spam Detection. The model is trained on the basis of millions of emails on different parameters, and whenever it receives a new email, it identifies whether the email is spam or not. If the email is spam, then it is moved to the Spam folder.
Here OUTPUT is always DISCRETE.
Types:
1.1 Logistic Regression:
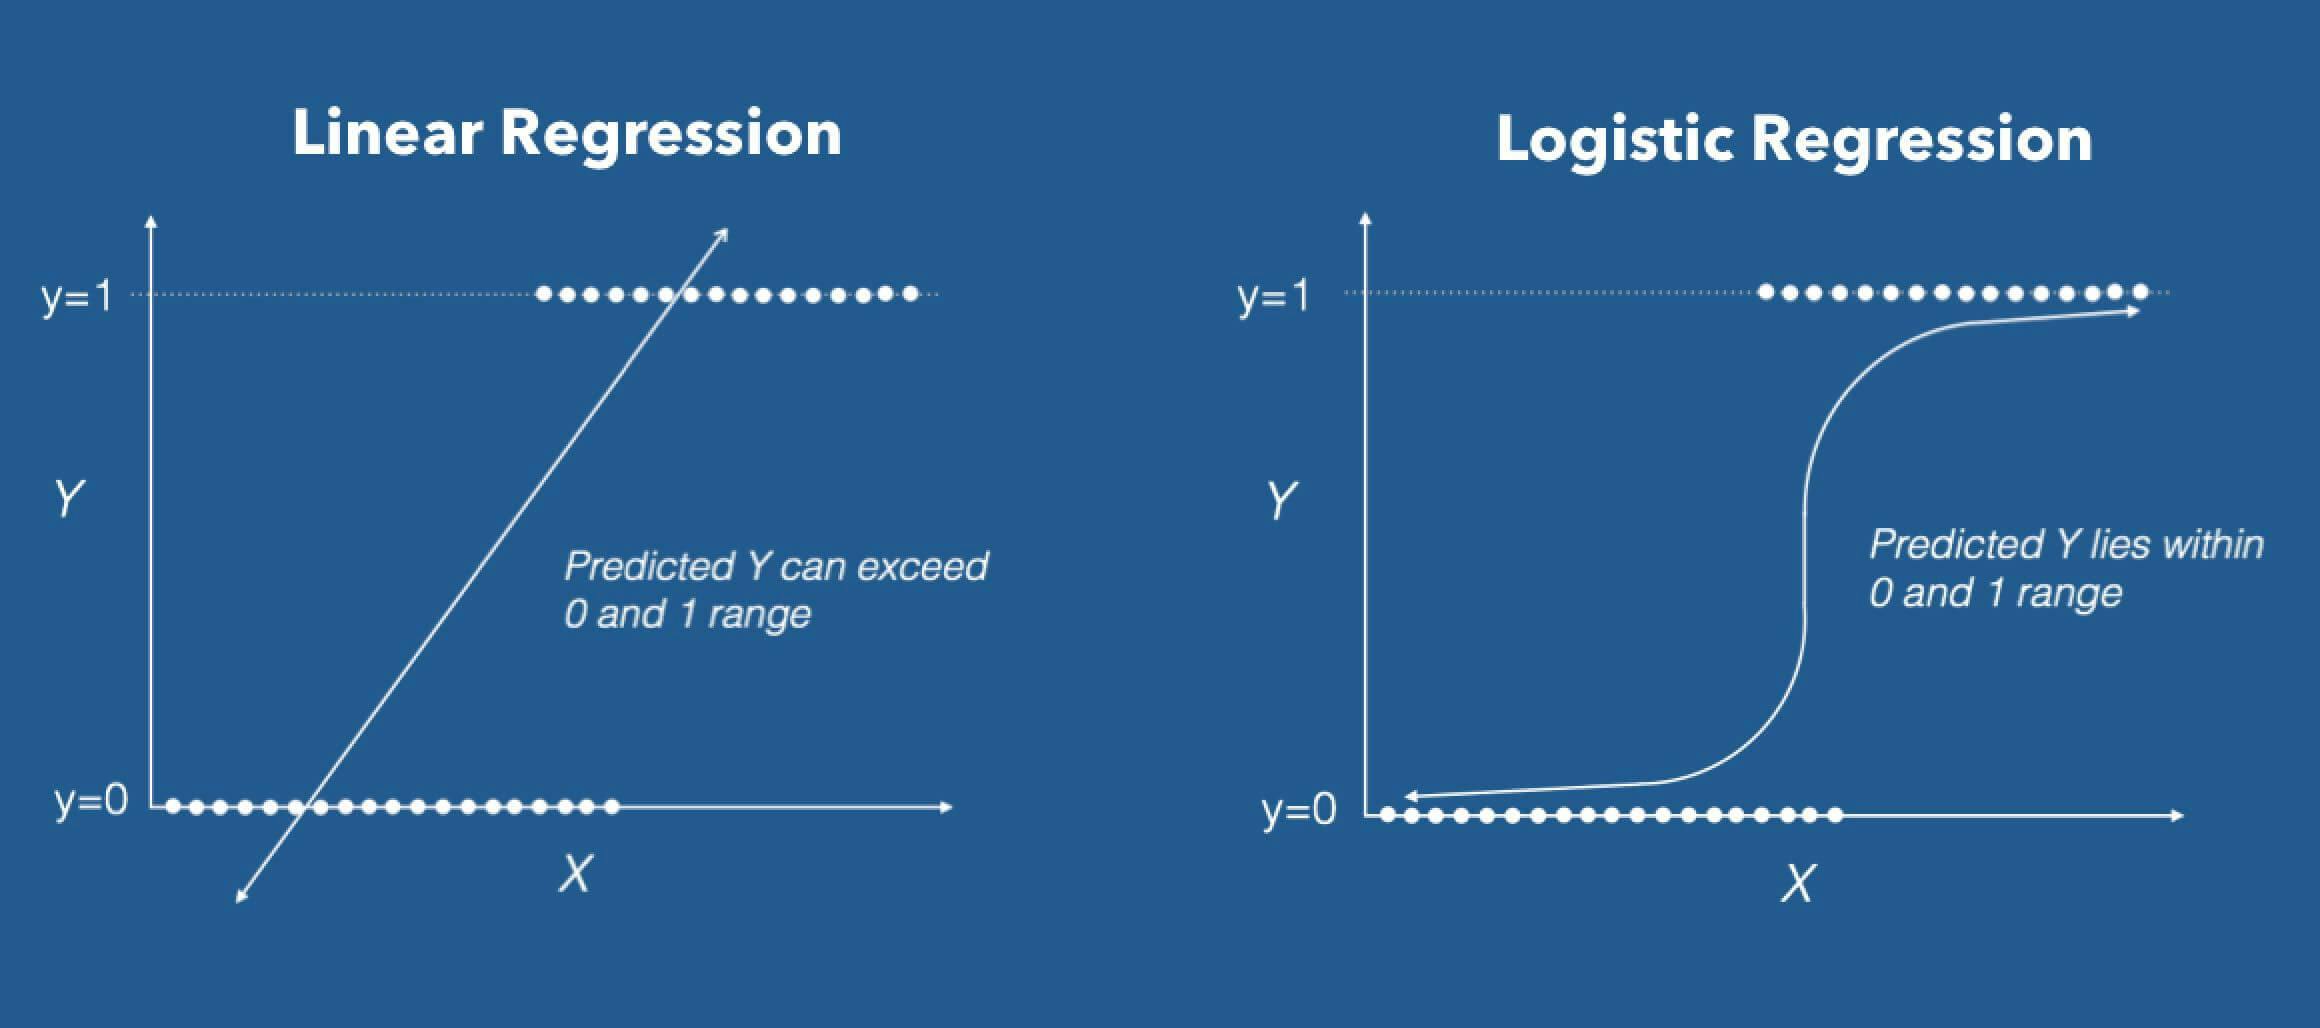
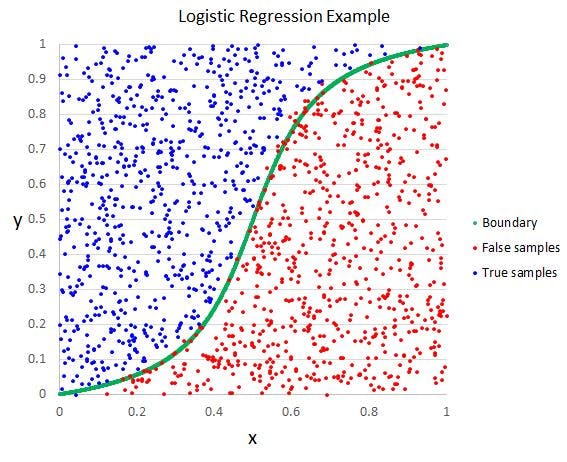
The output values can only be between 0 and 1
DIFFERENCE BETWEEN LOGISTIC AND LINEAR REGRESSION IS:
Values of Linear Reg can exceed 0 and 1 range, while values of Logistic Reg lies within 0 and 1 range
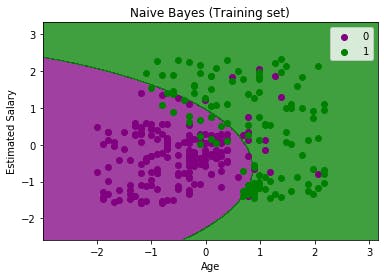
1.2 Naive Bayes Classifier:
It is a probabilistic classifier, which means it predicts on the basis of the probability of an object.
- Naïve: It is called Naïve because it assumes that the occurrence of a certain feature is independent of the occurrence of other features. Such as if the fruit is identified on the bases of color, shape, and taste, then red, spherical, and sweet fruit is recognized as an apple. Hence each feature individually contributes to identify that it is an apple without depending on each other.
- Bayes: It is called Bayes because it depends on the principle of Bayes' Theorem.
Where,
- P(A|B) is Posterior probability: Probability of hypothesis A on the observed event B.
- P(B|A) is Likelihood probability: Probability of the evidence given that the probability of a hypothesis is true.
- P(A) is Prior Probability: Probability of hypothesis before observing the evidence.
- P(B) is Marginal Probability: Probability of Evidence.
1.3 K-Nearest Neighbor:
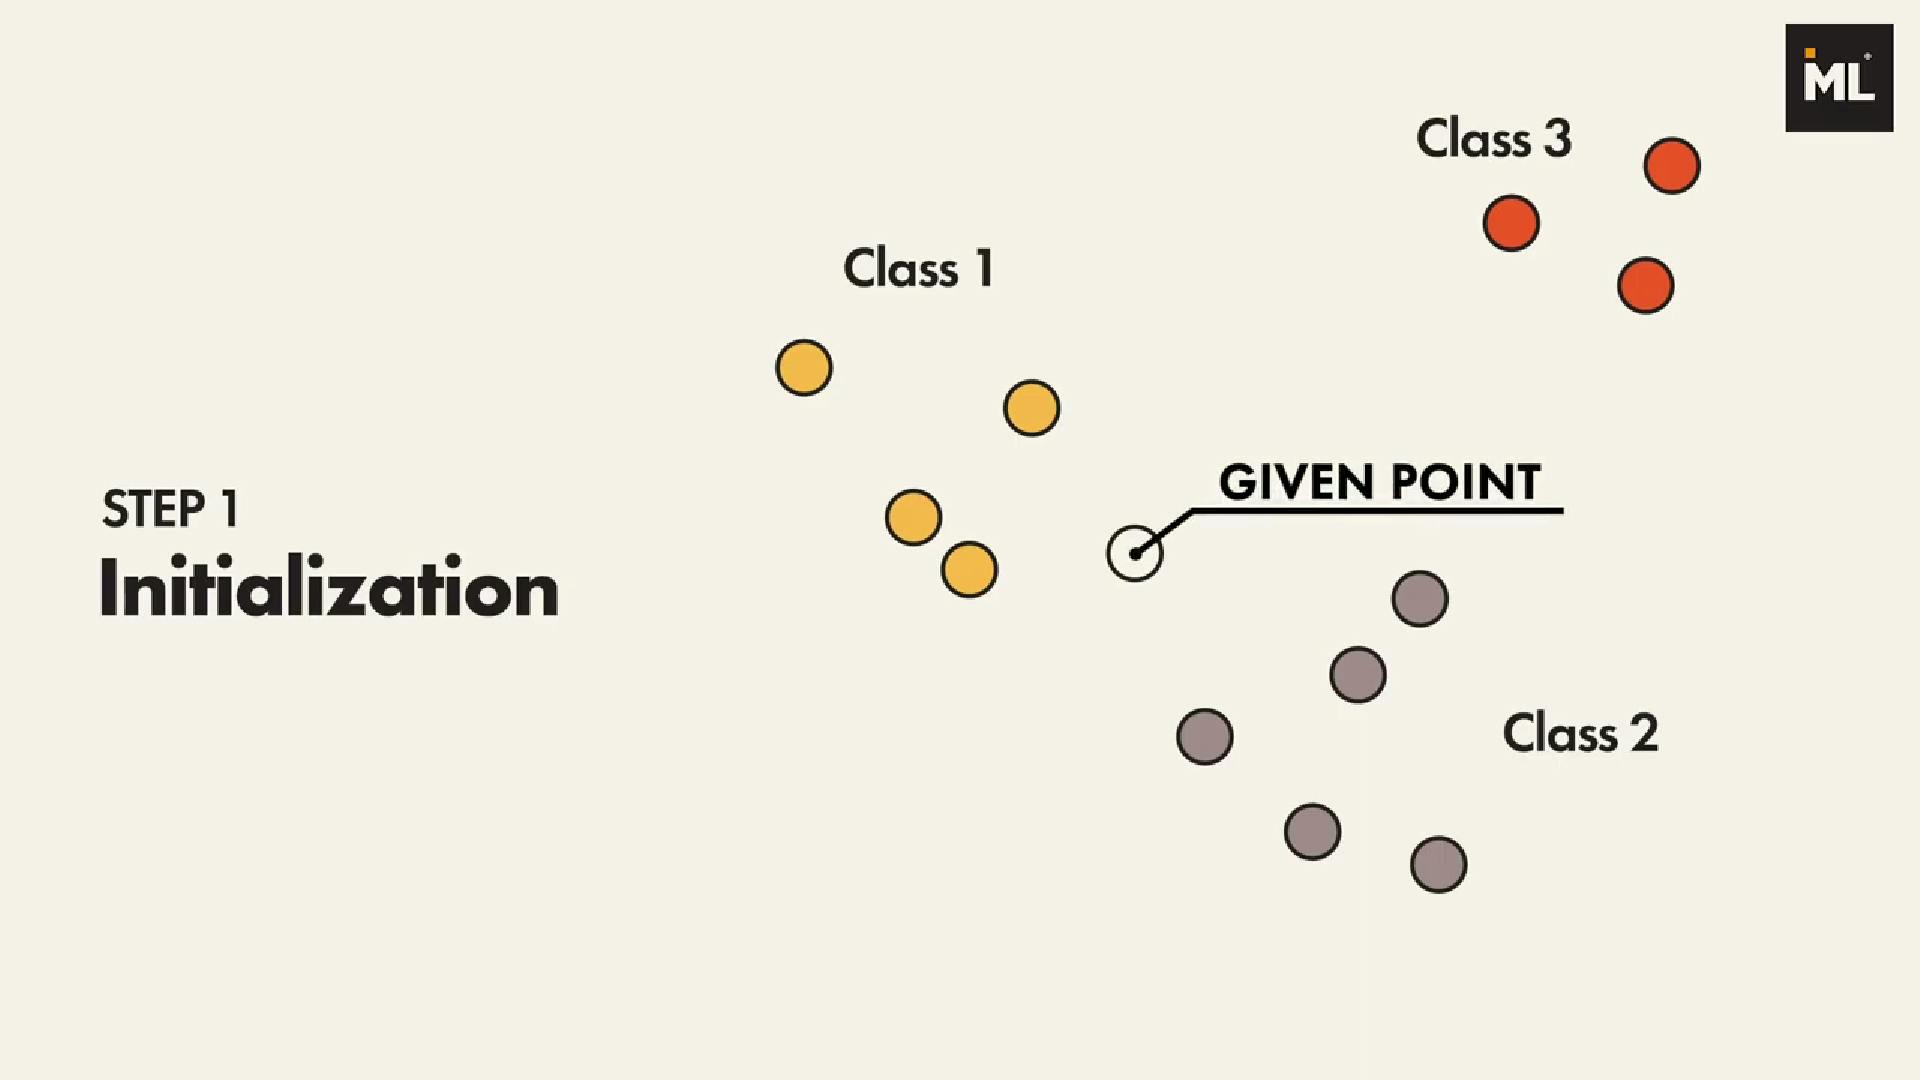
- Let’s say we want to classify the given point into one of the three groups.
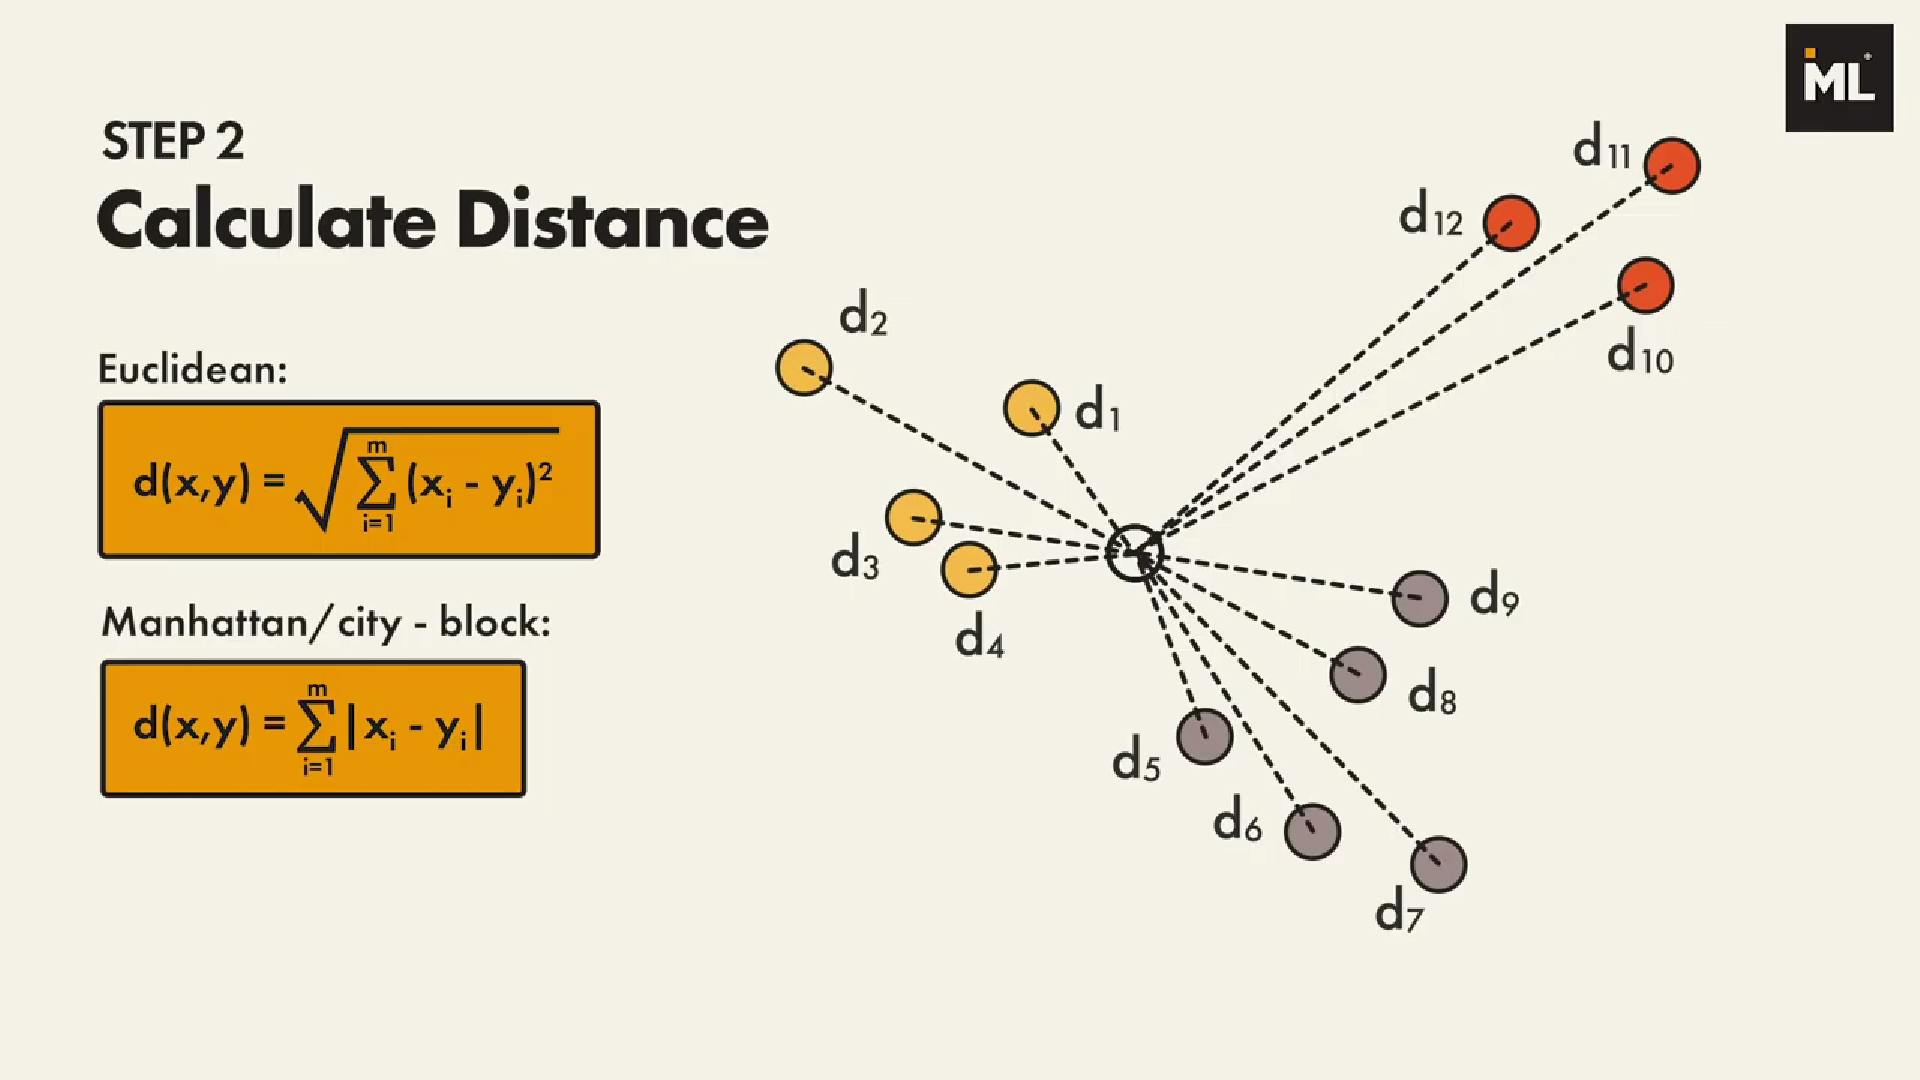
- In order to find the k nearest neighbors of the given point, we need to calculate the distance between the given point to the other points.
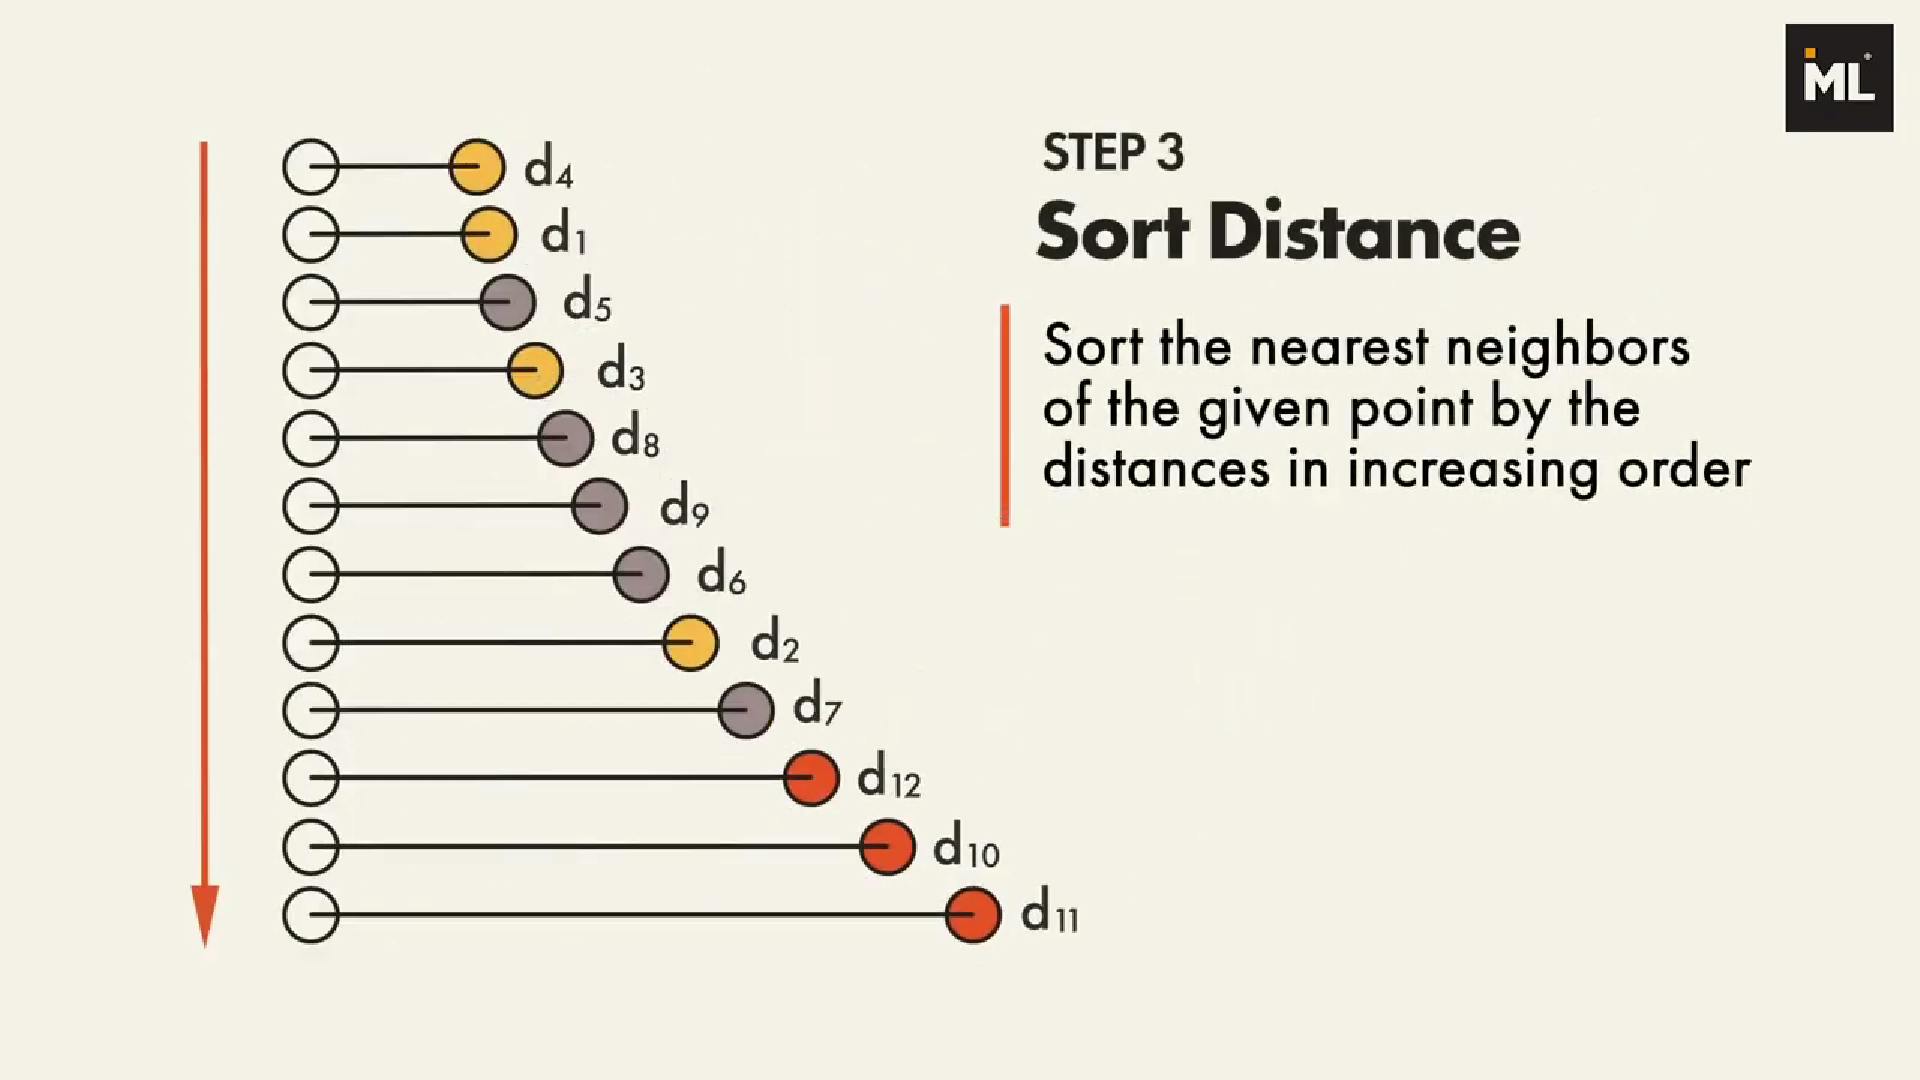
- Then, we need to sort the nearest neighbors of the given point by the distances in increasing order.
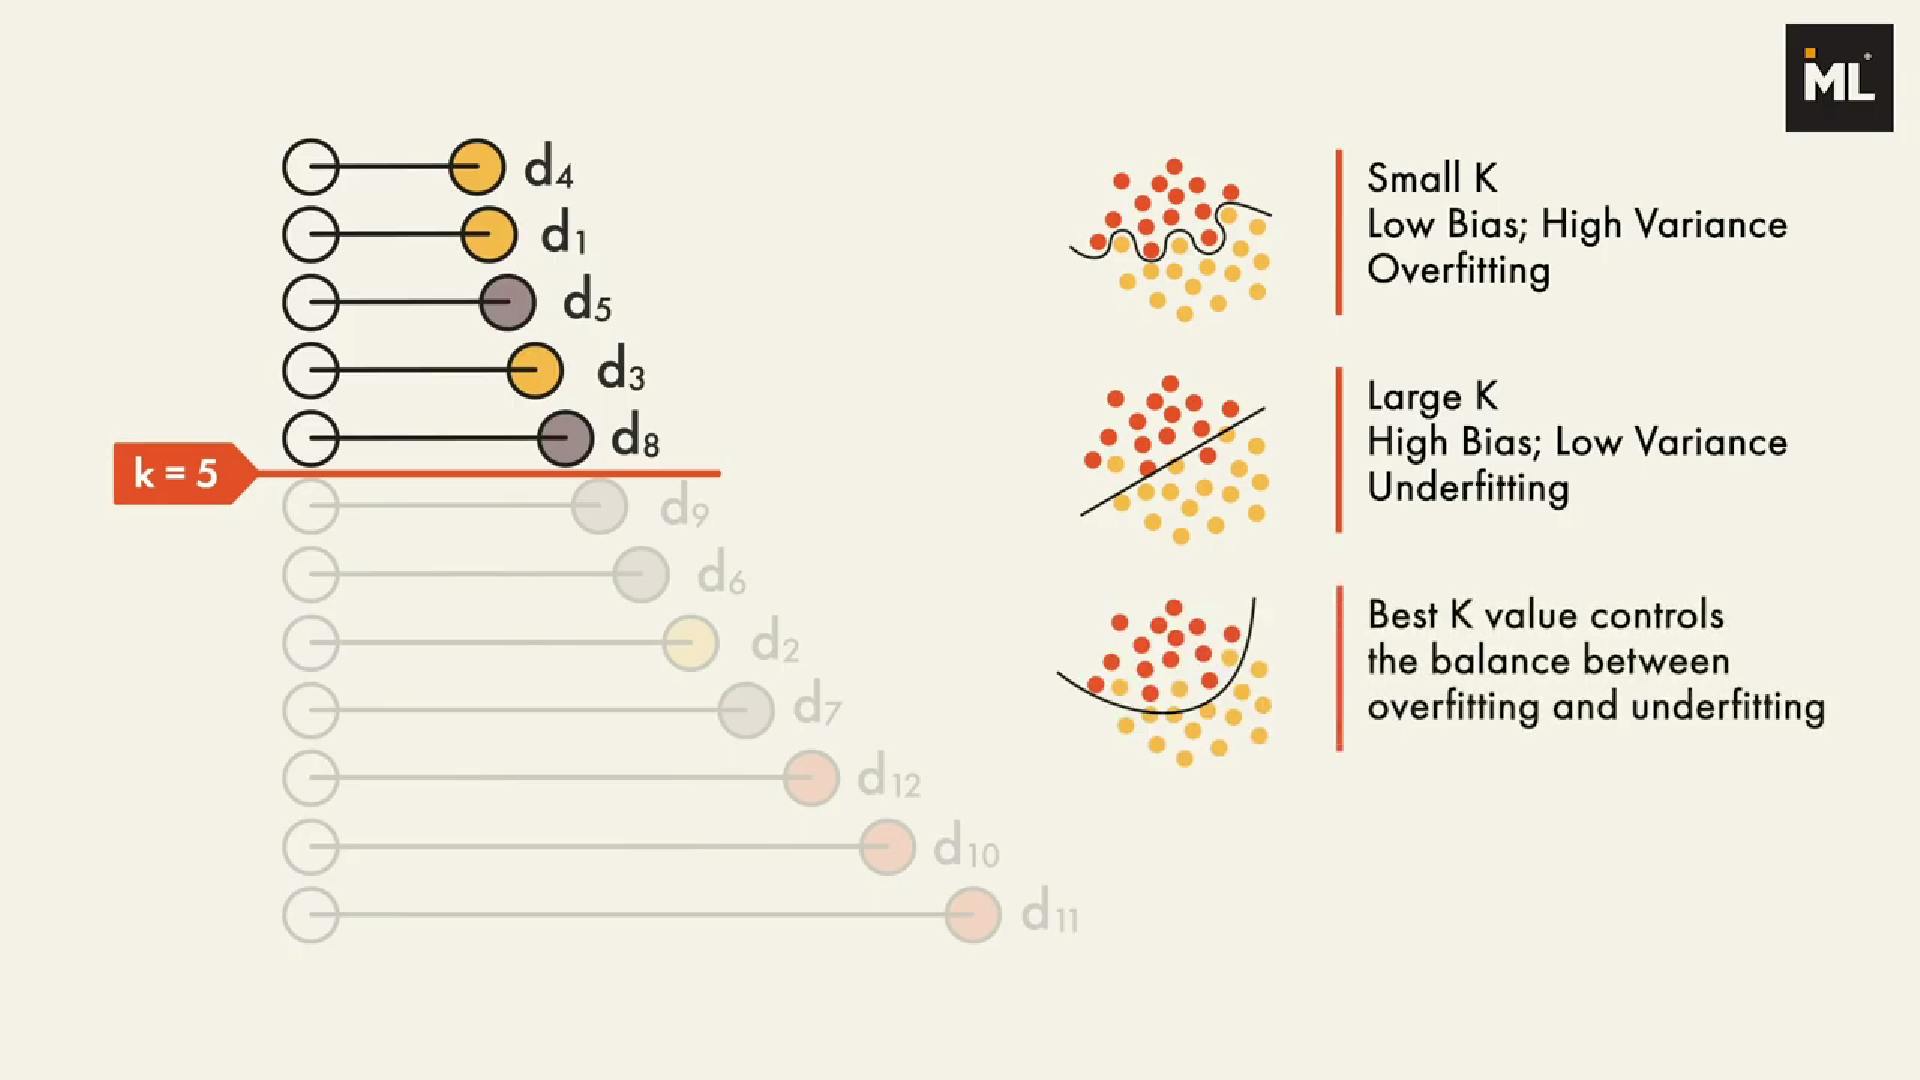
- For the classification problem, the point is classified by a vote of its neighbors, then the point is assigned to the class most common among its k nearest neighbors.
# knn from sklearn
from sklearn import neighbors, datasets
# import some data to play with
iris = datasets.load_iris()
# we only take the first two features for demonstration
X = iris.data[:, :2]
y = iris.target
clf = neighbors.KNeighborsClassifier(n_neighbors=15)
clf.fit(X,y)
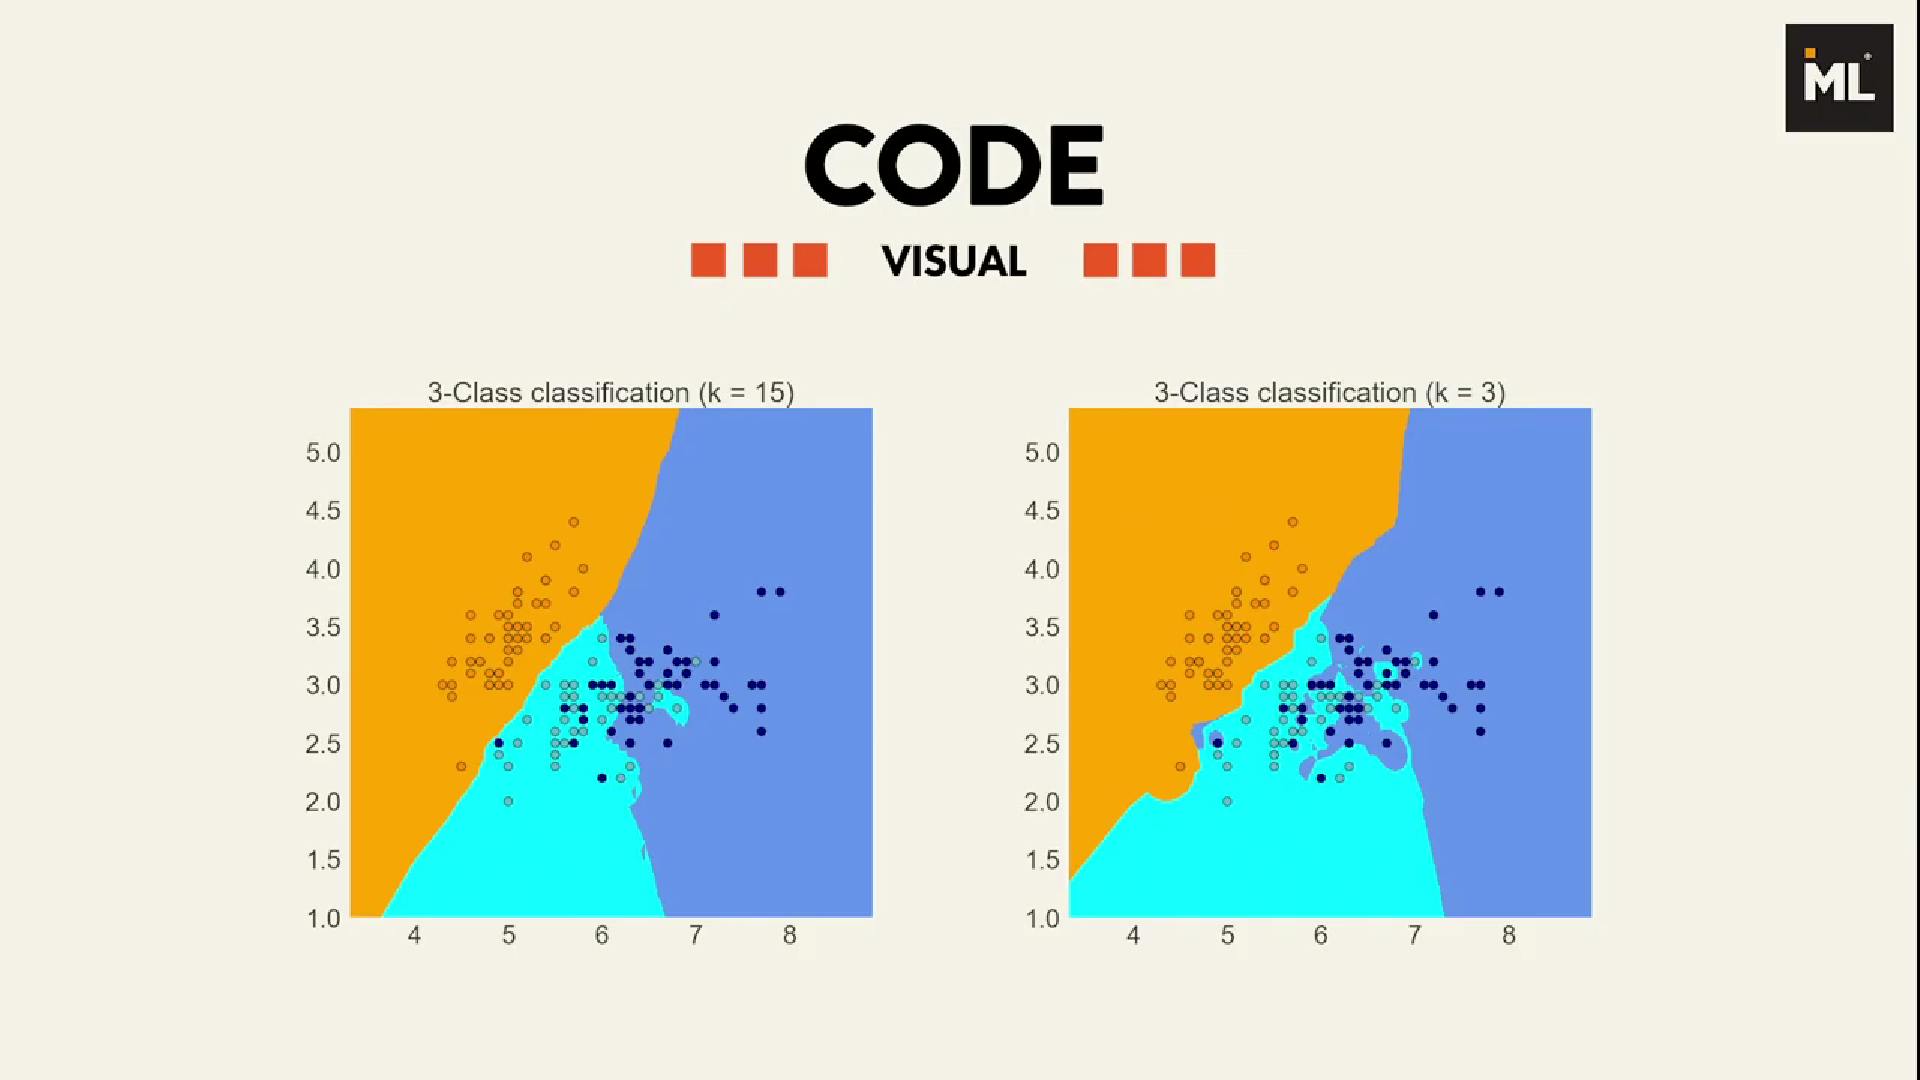
The left plot shows classification decision boundary with k = 15, and the right plot is for k = 3.
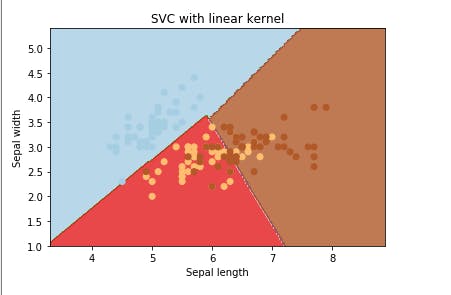
1.4 Support Vector Machine:
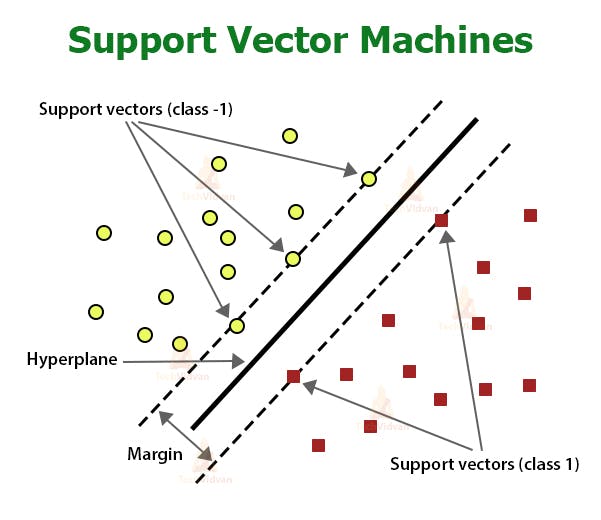
Dots = Features
SVMs perform the classification test by drawing a hyperplane that is a line in 2d or 3d
In such a way that all points of one category are on one side of the hyperplane and all points of the other category are on the other side
There could be multiple such hyperplanes
Distance between 2 categories is called the margin and the points that fall exactly on the margin are called the supporting vector
